
Four hours of live election coverage on Fox 13 was coordinated months in advance with 8 Viz channels, custom-developed software to pull in local results, an internal web interface for the producers and even an iPad application for on-air talent.
Technical Process
Initially, raw election data was provided to the media by the Lieutenant Governor’s office via a secure FTP server. A custom-written PHP script running on a Mac Mini server collected the data automatically and parsed/stored it in a local MySQL database for faster in-house recalling for the Viz output.
Stringent testing was undertaken, and subsequently redundancy was in place in case of an Internet outage; using a MacBook and a 4G hotspot to collect data.
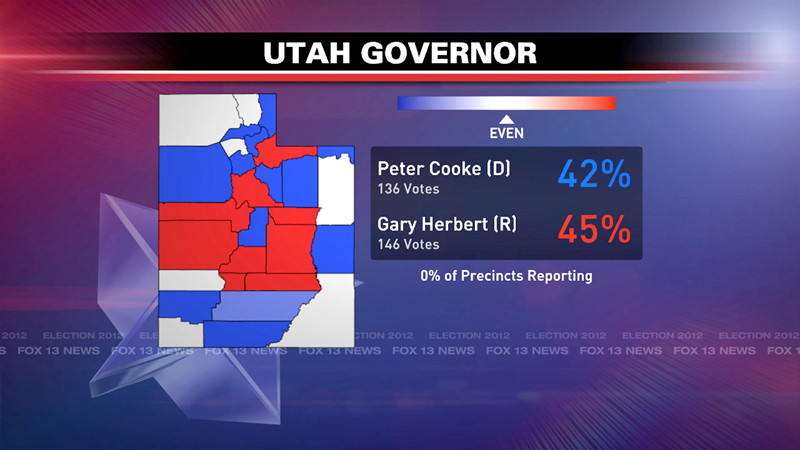
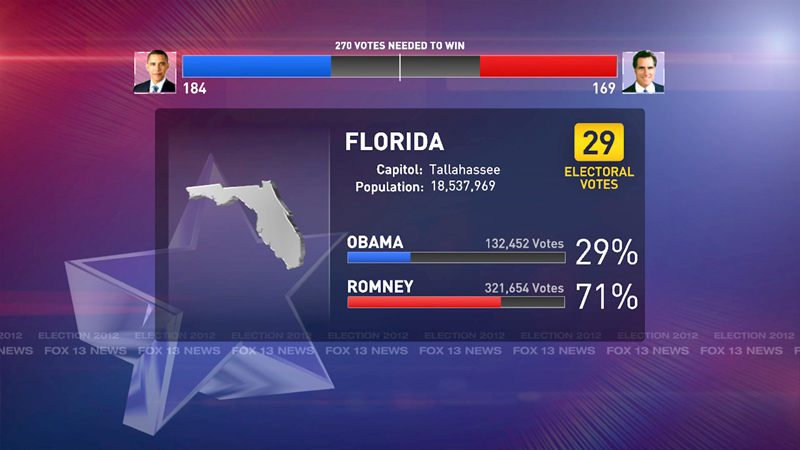
The data that was provided was incredibly robust. It included the statewide votes broken down, county-by-county. The overall results could be shown with a little math as well as county-by-county results. For the Governor’s race, I created a useful Viz scene that would show each county’s ideal candidate choice: every percent lead that a candidate had over the other, would be colored a stronger shade of blue or red, right up to a 10% lead.
Producer Interface
I created an internal web site to display all live results to talent and producers. The most important races were shown on a live dashboard. The most up-to-date results were color coded; so that producers could see the most relevant information first. The site was also iPad accessible for any equipped talent, allowing them to see and understand the results slightly ahead of those being broadcast.
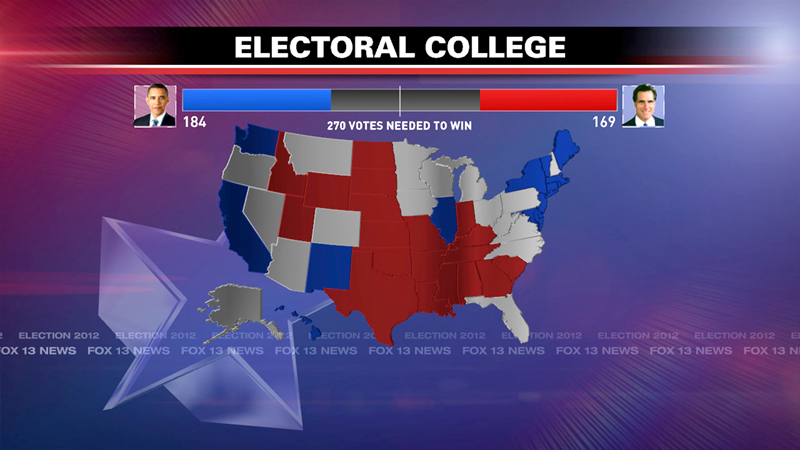
Political reporter Max Roth was able to use his iPad to dynamically color U.S. states red or blue live on air. The program was pre-loaded with expected results, swing states and historical election results for comparison.
On Air
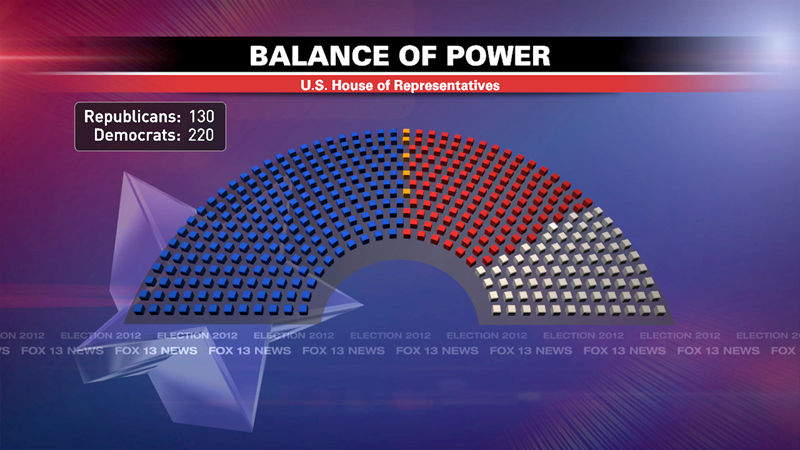
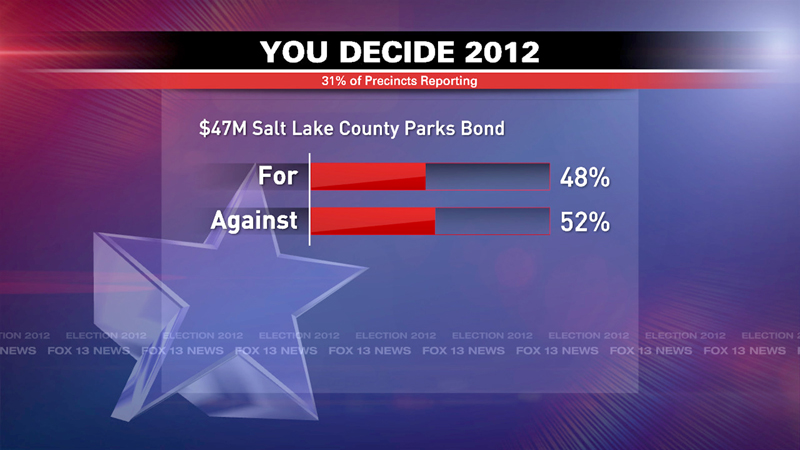
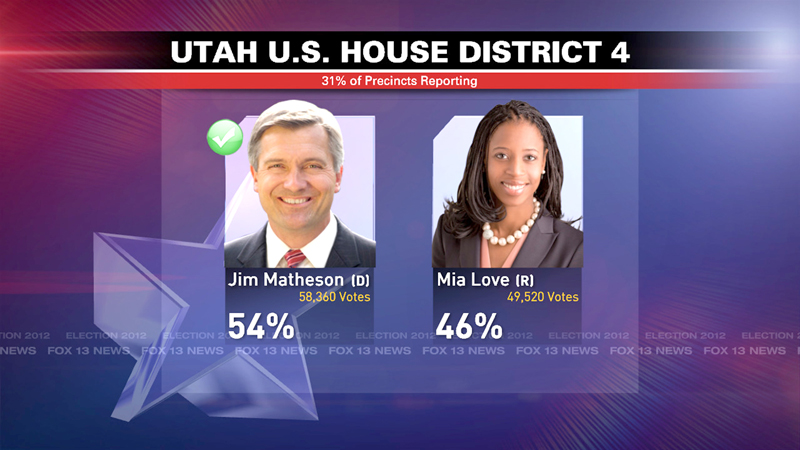
The on air VizRT graphics were able to break down all of the local and national results county-by-county and even state-by-state. Many times, the election result graphics updated live on air with mere seconds-old information that producers were seeing for the very first time.
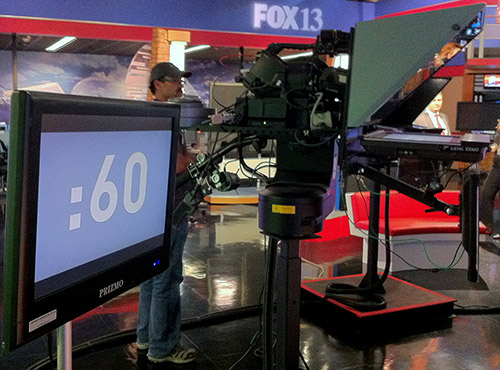
Timely Debate
Our political reporter wanted to make sure candidates spoke within their time-frame for pre-election debates. I created a 60-second key-able countdown clock that would also prominently display the remaining time on another Viz engine shown on monitors throughout the studio so that the candidates could see. To ensure there was no confusion, the screen would turn yellow, followed by red when the candidates had gone over their time.
Highlights
- Viz scenes were entirely script driven
- Result data was parsed into a local SQL database
- Internal dashboard showed most up to date results
- Script-driven results ticker on air throughout broadcast
- Technical and procedural contingencies in place
- Cinema 4D graphic package design